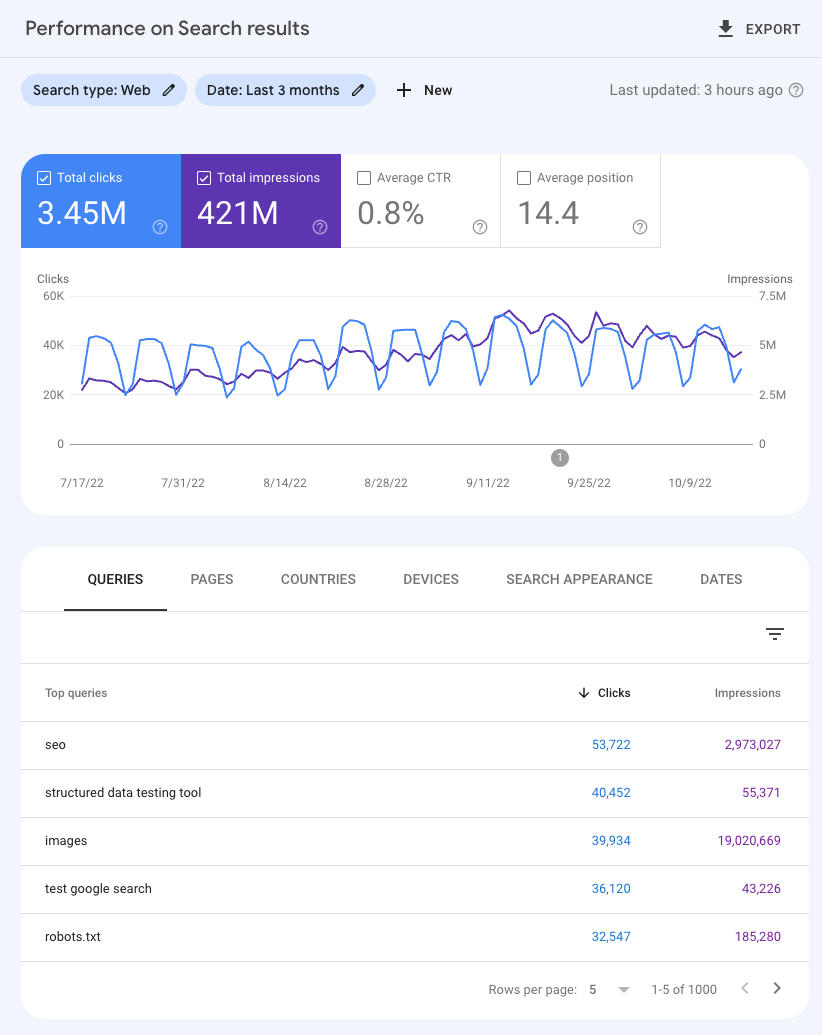
This latest article in our continuing series about Google Search Console explains how Google processes the most widely used data in Search Console – the Search performance data – both through the Performance report and the Search Analytics API. How and why should this data be used?
There are many reasons to set up and use a Google Search Console account if you manage a website, but perhaps the most important and insightful report is the Performance Data. This tool contains four key metrics that show how your search traffic changes over time in Google search:
– Clicks: Count of user clicks from Google Search results to your website;
– Impressions: Count of times users saw your website in the Google search results;
– CTR (Click-through rate): The click count divided by the impression count;
– Position: The average position in search results for the URL, query, or for the website in general.
Each of these metrics can be analysed using a range of filters and also for different dimensions so that it’s possible to check how each of the queries, pages, countries, devices, or search appearances driving traffic to your website are performing. This data can be used to find ways to make your website more visible and ultimately get more traffic out of Google.
There are several ways to access the Search performance data, including the Search Console interface, the Search Analytics API, the Looker / Data Studio connector, and spreadsheets (requires manual download from the interface).
If you’re using the Search Console interface, the dimensions are available through the filters or through the dimensions tables shown in the chart below:

However, when you use these reports, you need to bear in mind that there are two main limitations to the data: privacy filtering and daily data row limit:
Privacy Filtering
Some search queries (called anonymised queries) are not included in Search Console data to protect the privacy of the user making the query.
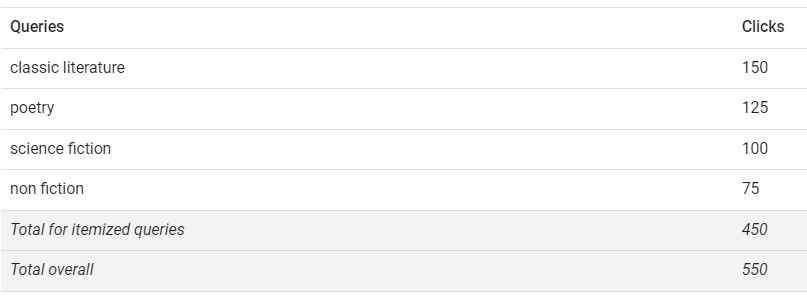
Anonymised queries are those that aren’t issued by more than a few dozen users over a two-to-three month period. To protect privacy, the actual queries won’t be shown in the Search performance data. This is why they’re referred to as anonymised queries. While the actual anonymised queries are always omitted from the tables, they are included in chart totals, unless you filter by query, as shown here:

If all the itemised queries are added up, as the chart shows, there were 450 clicks. There are also 550 overall clicks to the site. That number is higher because it includes all the itemised clicks plus the clicks from anonymised queries, which aren’t listed.
The anonymised queries are omitted whenever a filter is applied, so there will be a discrepancy between the itemised and total queries in these situations.
Daily Data Row Limit
Due to limitations related to serving latency, storage, processing resources, and others, Search Console has a limit on the amount of data that can be displayed or exported. These limits won’t affect the majority of properties in Search Console. A few very large websites can be affected by this, but even for those Google believes the remaining data will be large enough to create a representative sample of data.
For requests that don’t involve query or URL dimensions, such as countries, devices, and Search Appearances, Search Console will display and export all the data.
You can learn more about these performance data filtering and limits from this performance documentation.
If you want to know more about how Google Search Console can be best used to help your business attract more traffic from Google, please get in touch.
