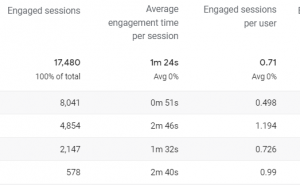
In our latest article covering the new Google Analytics 4 (GA4) reporting tool, we look at the tracking of engaged sessions, and how this differs from the bounce rate metrics used in the traditional Universal Analytics reports. These are key metrics for any website owner or marketer to be tracking, so what’s changed in GA4 and how should this data be used?
Since Google Analytics first launched in 2005, bounce rate has been a key metric that users referred to, since it indicated the level of user engagement with a website. Bounce rate reported the percentage of sessions that landed on the site and went no further, so there was no further page click or other interaction with the site and the implication was that the visitor to the site left without taking any further action.
Bounce rate typically indicated a poor user interaction with a site the higher it was (and typical ‘average’ rates would be around 40% although this could vary widely depending on the function of a website). However, bounce rate is not a perfect figure and the main issue was that there was no time spent on the site being recorded (as there was no second click action) and so all bounces showed no time on site.
This could therefore be a misleading figure for some websites, where visitors may get the information they want from a single page, or where sites were driving traffic from social media because users would typically visit a page to read an article but then return to the previous site, regardless of the time spent reading the content.
The new Google Analytics 4 reports have changed their metrics to try to address this, as well as to put a positive metric in the reports, rather than the more ‘negative’ bounce rate figure. What users of the new GA4 interface now see in many reports are ‘Engaged Sessions’ and related figures to this – engagement rate, engaged sessions per user, average engagement time per session.
 This is the definition of these metrics:
- Engaged Sessions – The number of sessions that lasted longer than 10 seconds, or had a conversion event, or had 2 or more screen or page views.
- Engagement Rate – The percentage of engaged sessions.
- Average Engagement Time Per Session – User engagement duration per session.
- Engaged Sessions Per User – The number of engaged sessions divided by the number of users.
So this is quite a significant change with GA4 but one that should help users get a better understanding of the real engagement levels with their website, whereas the existing bounce rate was not a perfect metric. As more people start to use the GA4 reports and track their websites and apps with this system, bounce rate will become a thing of the past and no longer a metric used in analysing the performance of a site.
For more information or help with Google Analytics 4, or the Demo Account, please make contact.
