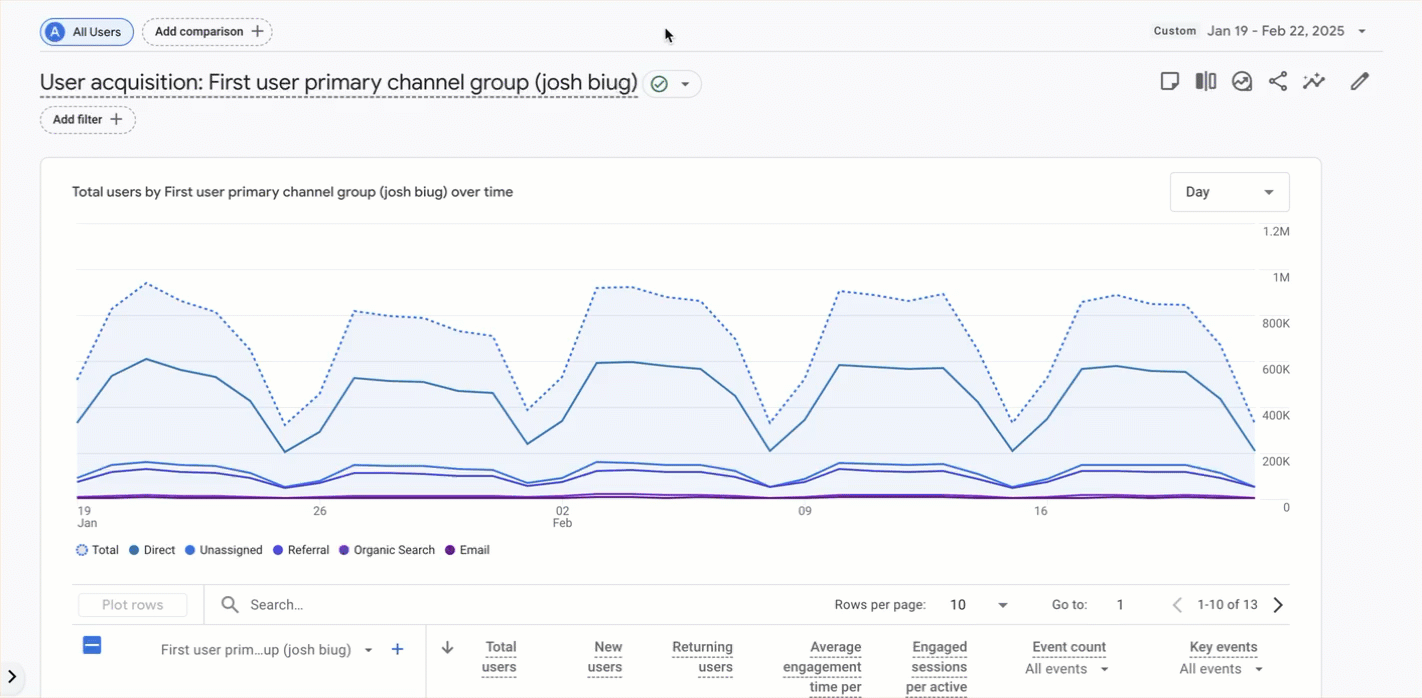
Annotations allow users to add notes directly to Google Analytics 4 (GA4) reports, making it easier to record events, explain changes in data, or highlight key observations for users. They can be used to identify and explain spikes or dips in traffic, marketing campaign launches, product launches, and more.
Annotations were a feature in the previous Analytics version (Universal) and it had been frustrating that the option was not available in GA4 until now, so it’s a welcome addition that they’ve been added back into the current version 4.
To use annotations
- Access permission must be an Editor or above at the property level to create and edit annotations and a Viewer or above to view annotations.
- Each property has a limit of 1000 annotations.
- Annotations can be created either in Google Analytics Reports with line graphs or the Admin API.
To create annotations
1. In Google Analytics, click Reports on the left.
2. Open the report that you wish to annotate and right click any data point on any line graph.
3. Click Add annotation.
4. Add these annotation details:
a. Title: The character limit is 60 characters.
b. Description: The character limit is 150 characters.
c. Date or date range: You can select a single date or a date range.
d. Colour
5. Click Create annotation.
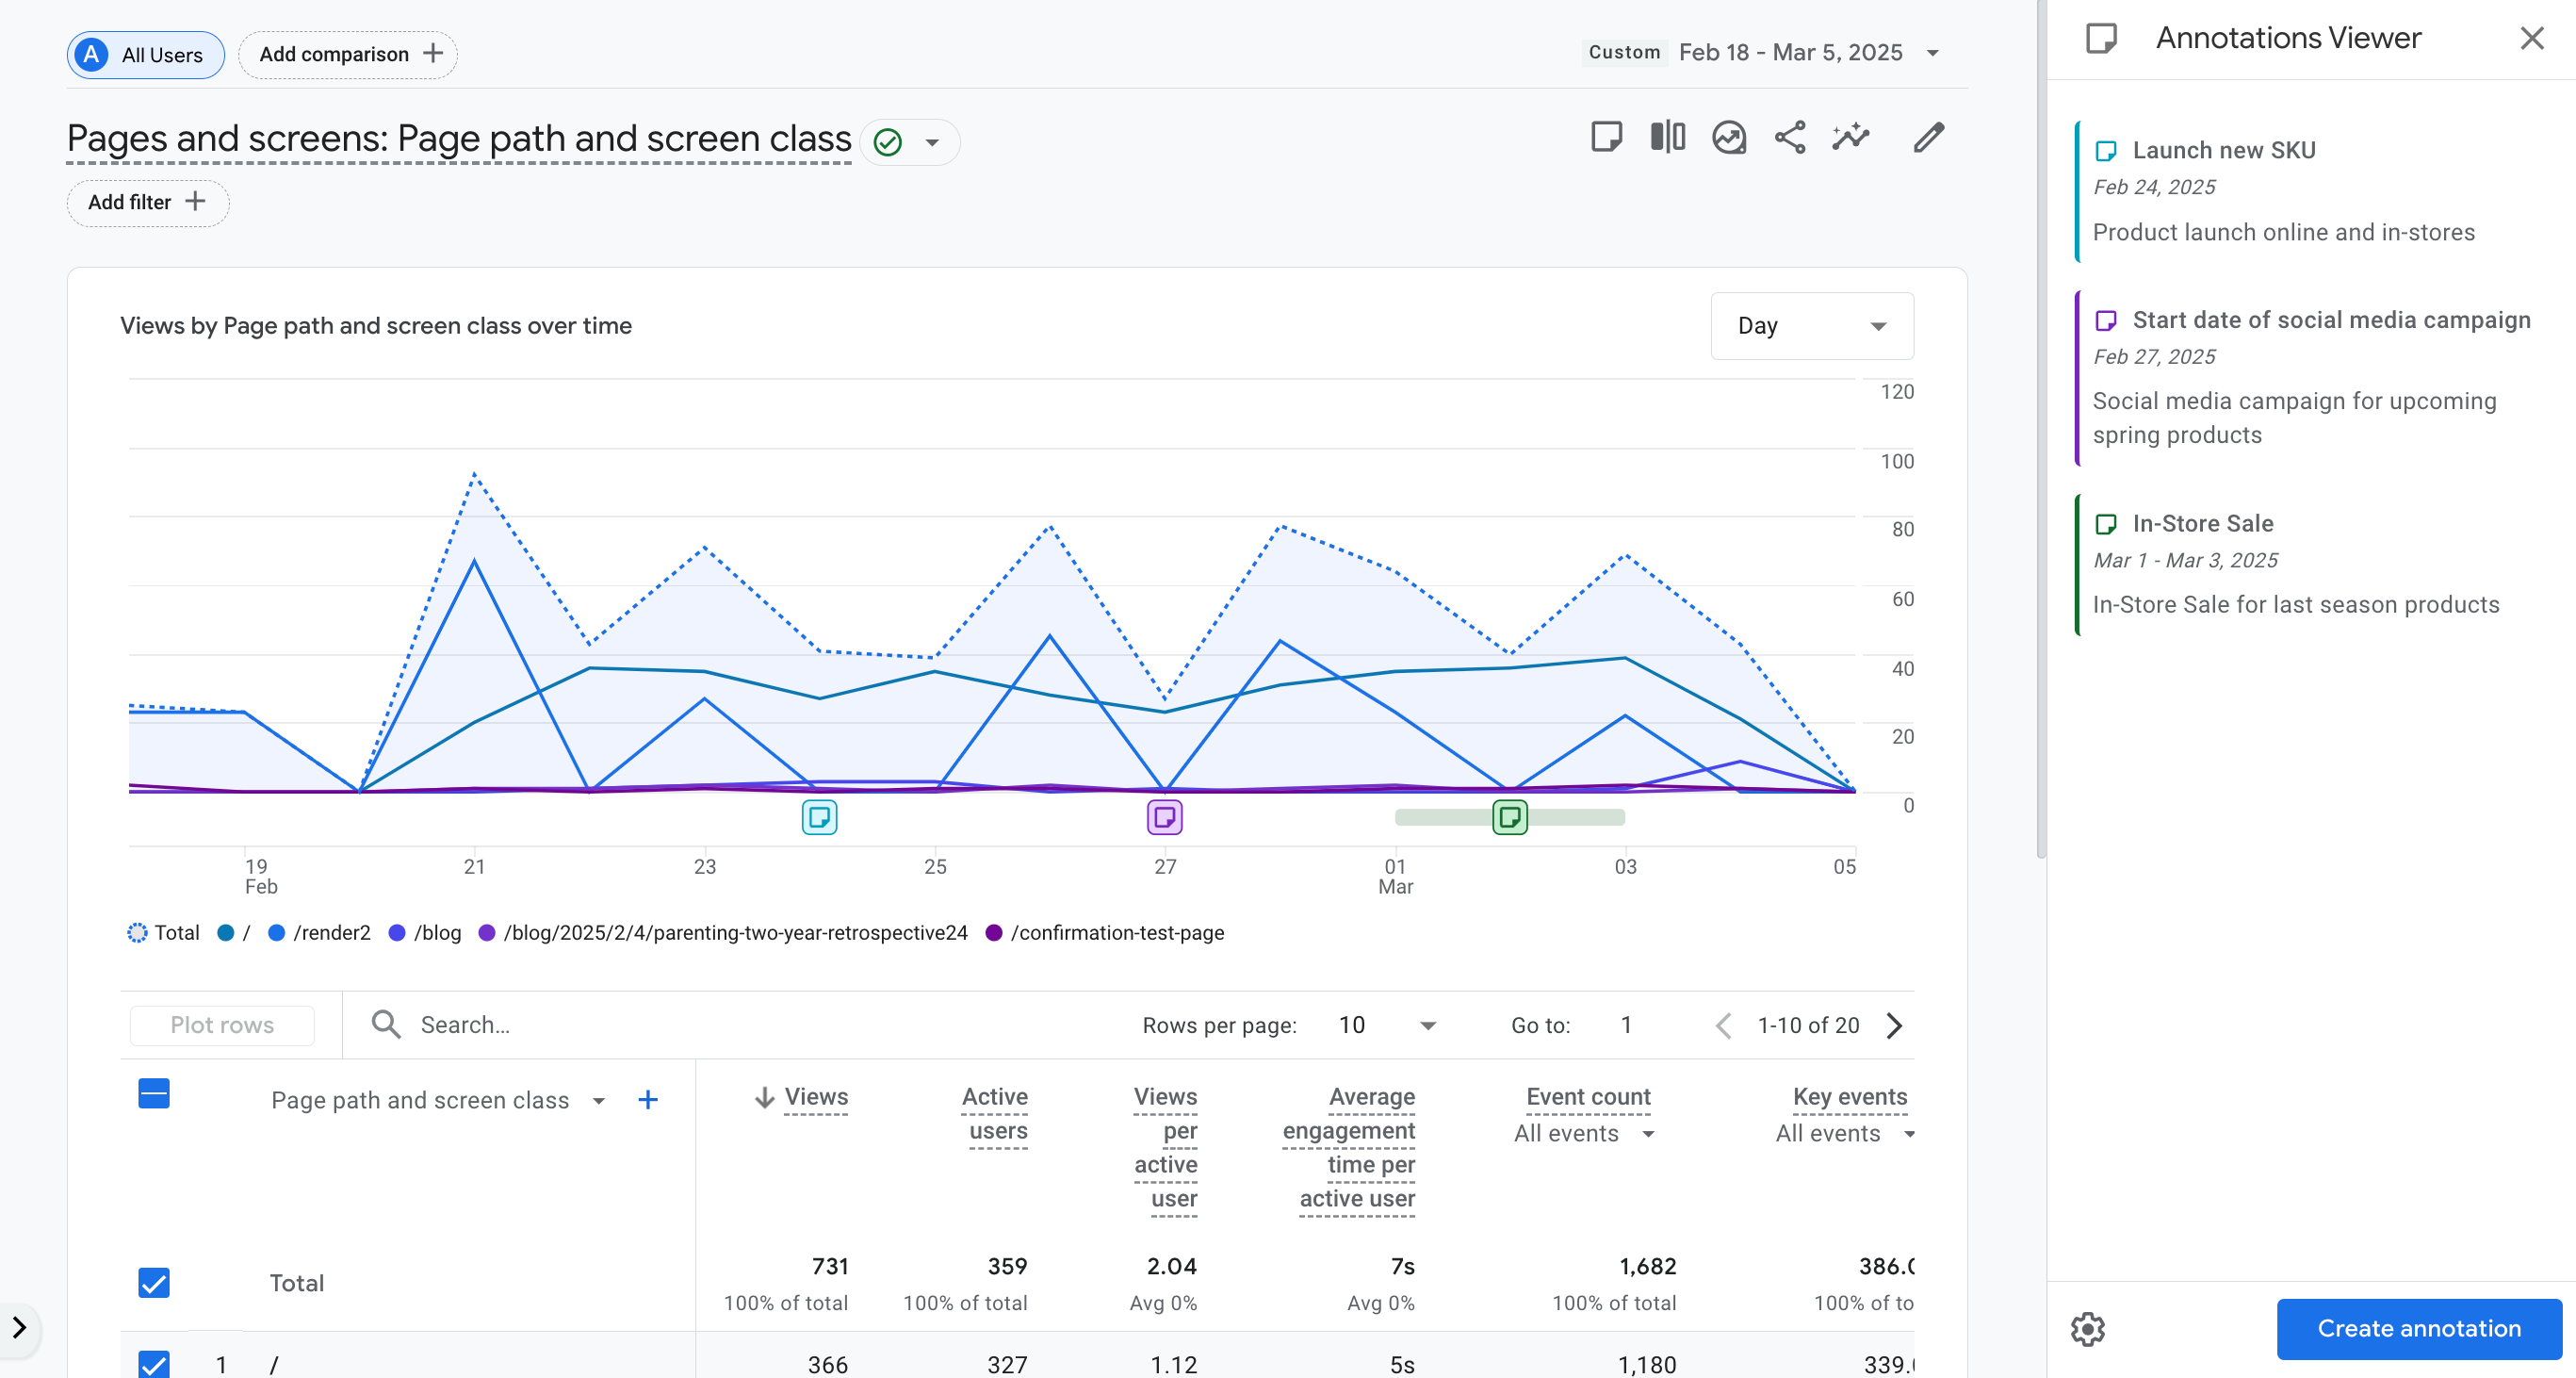
When an annotation is created, it’ll be visible across all reports and report cards with line graphs. However, all annotations and annotations bars for date ranges can be hidden.
Note: If there will be a high number of annotations with overlapping date ranges, it’s recommended to create annotations for a single date instead.
View annotation details
Once an annotation is created, an icon appears below the line graph on the report. Hover over to view the annotation details in the hover card, or click the annotation icon to view details in the “Annotations Viewer” panel.
View all annotations for a property
1. In Google Analytics, click Admin on the left.
2. Under “Data display”, click Annotations.
3. View the details of all annotations for a property. Depending on your access level, you may be able to create, edit, delete, or export these annotations from Admin.
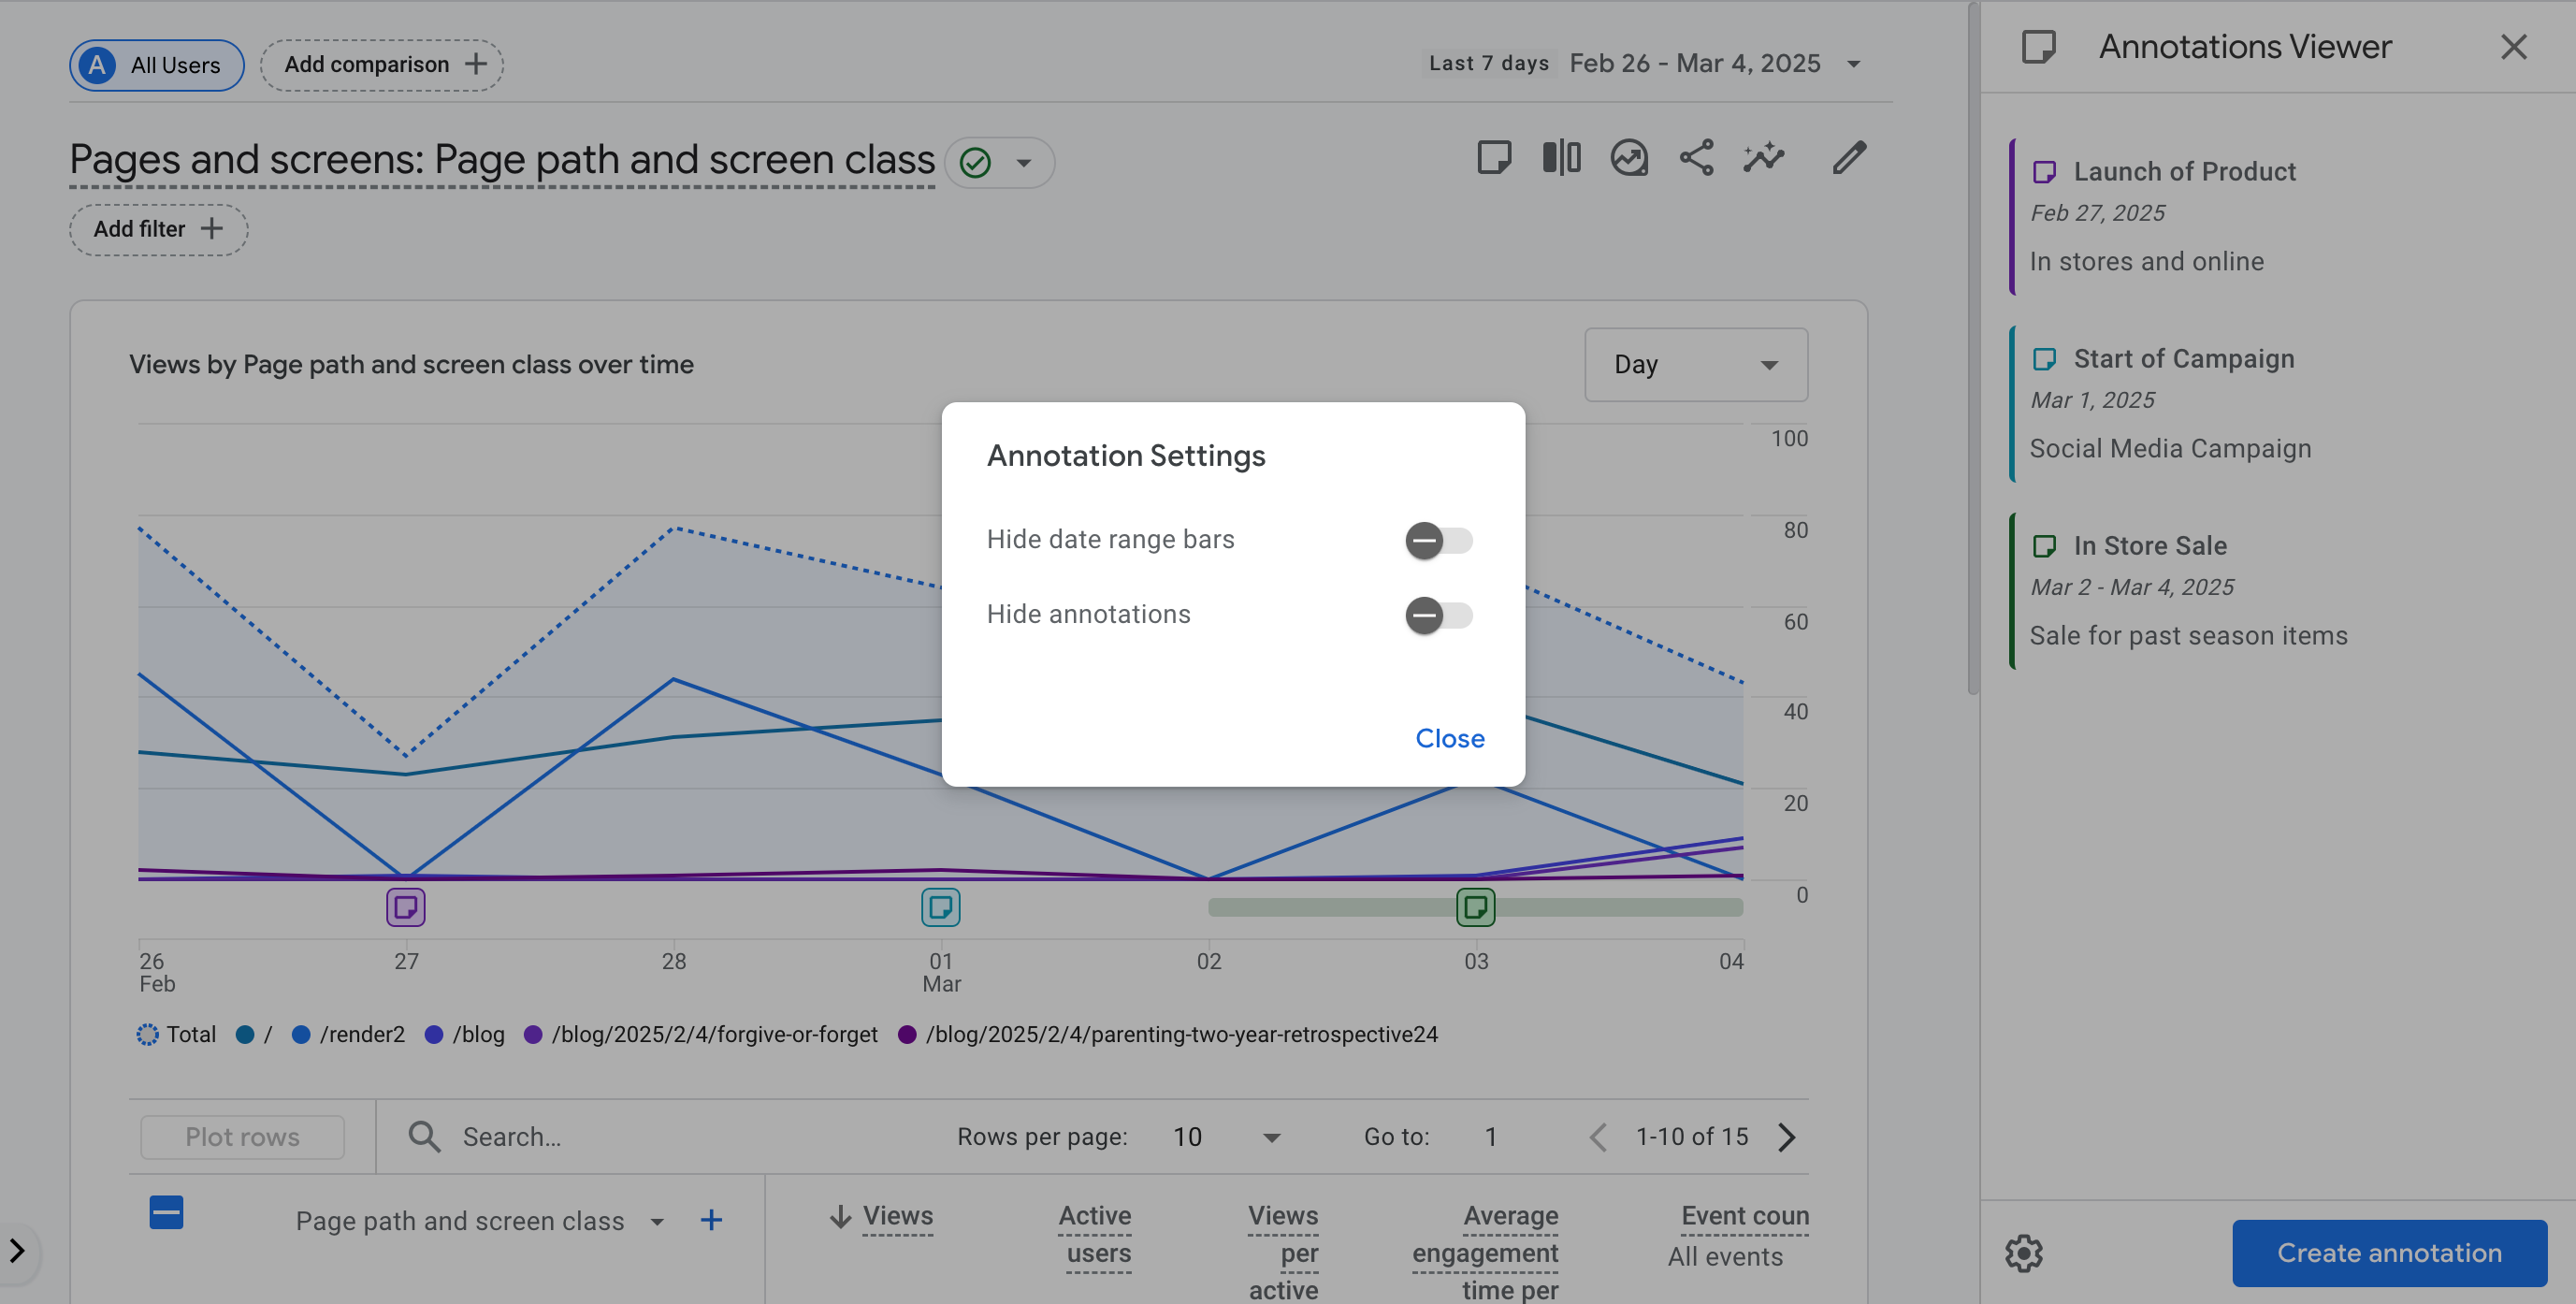
Change your annotation settings
Annotation settings can be changed in the “Annotations Settings” section found at the bottom left of the “Annotations Viewer” panel. Through “Annotations Settings”, a toggle can be used to hide or unhide all your annotations and annotations bars for date ranges. When the settings are changed this will be applied to all of the annotations.
Google Analytics-created annotations
When a significant data-impacting event occurs, Google Analytics may create an annotation to notify users about the issue on the relevant date and data. These annotations look similar to user created annotations, except that they can’t be edited or deleted. Hover the mouse cursor over the system annotation icon Annotations (system) icon to view details.
Annotations are a long over-due and useful addition to GA4, and one of the various new features that have recently been added to the tool. If you want to know how the use of annotations can help your business, please get in touch.