As part of the continued development of Search Console as a website optimisation tool, Google has just added a new ‘Speed’ report, initially as an ‘experimental’ option. This is starting to roll out across all Search Console accounts, but may take some time to build up meaningful data for some websites. So what does it do, and is it useful?
 Google is regularly promoting the benefits of a fast loading website, particularly on mobiles which are now the main source of search activity. A faster loading website improves the user experience, helps to reduce bounce rates (people leaving the site without viewing a second page) and should also help to improve conversion rates, including sales for ecommerce stores. In addition, slow pages may be demoted in Google’s search results.
It’s therefore important to be aware of your website speed issues, and take action wherever possible. There is currently information available in Google Analytics, as well as the use of the more detailed PageSpeed Insights tool, which also provides recommendations of where a website can be improved. However, the new report in Search Console gives a wider overview across more pages of a website to identify where load issues may be a problem.
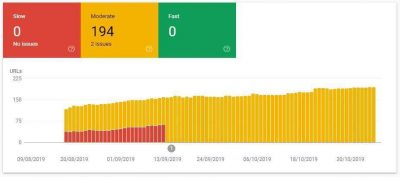
The new report shows page performance grouped by speed status, metric type, and similar URL type. Data is collected from the CrUX report (Chrome User Experience), which gathers anonymised metrics about performance times from actual users visiting your web pages (called field data). Each URL is allocated a label for either slow, moderate, or fast, relevant to a specific device type (mobile and desktop).
Google says the report is not designed to show the status of a specific URL, but rather to see a website’s performance as a whole, and troubleshoot issues affecting multiple pages on the site. If you then want to see speed data about a specific URL, it’s better to use PageSpeed Insights, which shows historic user data as well as live test data for a given URL.
The two metrics used to measure speed in the Search Console report are:
- FCP (first contentful paint): reports the time from when the user requests the URL until the browser renders the first visible element in the URL and pages are categorised into Fast (less than 1 second), Moderate (1-3 seconds) and Slow (over 3 seconds).
- FID (first input delay): reports the time from when a user first interacts with your page (when they clicked a link, tapped on a button, and so on) to the time when the browser responds to that interaction. These metrics are grouped into <100ms, 100-300ms and >300ms respectively.
Any noted issues are assigned to a group of URLs that have a similar user experience, since it’s assumed that performance issues in similar pages is probably due to the same underlying problem, such as a common slow-loading feature in the pages. Most sites are likely to see the majority of pages listed under the Slow grouping, or Moderate if lucky! Fast may be hard to achieve but certainly something to aim for.
This new report can be shared with other users – such as a web developer – without granting access to other pages in Search Console. If changes are then made to your website, you can confirm if the issue is resolved for all URLs by clicking on Start Tracking, which begins a 28-day monitoring session to check for instances of this issue in your site.
If this issue is not present in any URLs on your site during the 28-day window, the issue is considered fixed. The presence of that issue in any URL is enough to mark the issue as not fixed, although the status of individual URLs continue to be evaluated for the entire 28 days, regardless of issue status.
You can find more information about this new report on the Google Search Console help page, or you can contact us for help, if required.