As part of our regular series of articles on the new Google Analytics 4 (GA4) reporting tool, this month we look at the analysis options that are available and how you can use the Analysis Hub to create your own reports that are most relevant for your website.
When you first use the new GA4 interface, the range of reports appears much more concise than in the established Universal Analytics tool where users can review the core insights on their website performance. Many of the regular reports and data that have been used by website owners and marketers over previous years are no longer available, and so the aim of GA4 is to provide some basic level reports, but to give users the ability to create a wider range of reports that might be more relevant for their needs.
This is a good approach in one sense, as it cuts out the extensive range of reports that some users find overwhelming in the Universal Analytics tool. However, on the other hand this also makes GA4 more challenging for many users, as they have to learn the new analysis options to get to the data they might be interested in.
The Analysis section can be found in the left hand menu under the ‘Explore’ section, and within this menu are 2 options – the Analysis Hub and Template Gallery. Users can choose to create a new blank analysis, or use a template or predefined analysis to start quickly. When creating a new analysis, users can select the technique they want to use to analyse their data and then drag and drop dimensions and metrics from Variables to Tab Settings. The options in the Tab Settings vary by technique, and let users fine tune the data they see. Users can also interact with the data by mousing over and clicking the options or by adding segments and filters to refine the data.
There are 3 main sections for each analysis:
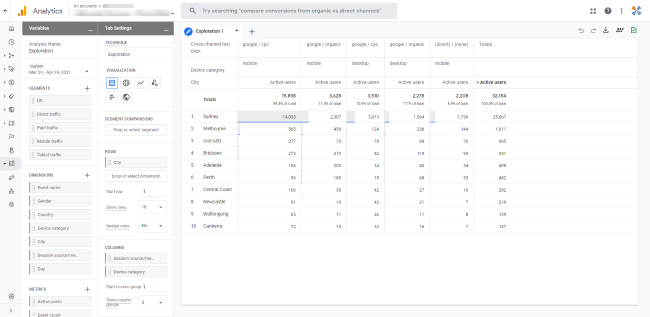
1) Canvas – the main panel displays the data using the selected technique. The canvas can have multiple tabs, letting users apply multiple techniques in a single analysis, including Exploration – which reflects the standard report format in Universal Analytics – as well as Cohort analysis, Funnel analysis, Segment overlap, User explorer, Path analysis and User lifetime.
2) Variables – the left hand panel provides access to the dimensions, metrics, and segments that can be used in the analysis. The timeframe of the analysis can also be changed in the Variables panel.
3) Tab Settings – these options allow users to configure the currently selected tab. Users should select the technique, add items from Variables, and then configure technique-specific options.
When building an analysis, users can add dimensions, metrics and segments to the Variables section to be used in the reports – similar to Data Studio report creation – and data can also be added to the Tab Settings. Up to 20 dimensions and metrics can be added to an analysis report.
There is also a template gallery to get users started with some of the basic analysis formats, and each new report is saved in the Analysis hub list, until it is deleted. Reports can also be shared with other users and up to 200 reports can be created in an Analytics property, which is likely to be plenty for most users!
There is more information about the Analysis sections in GA4 here. For more information or help with Google Analytics 4, or the Demo Account, please get in touch.