In our latest article focusing on the new Google Analytics 4 (GA4), this month we take a look the differences in analysing user behavior in the new reports compared to the Universal Analytics (UA) version, which is due to stop reporting from July 1st this year. There are some key differences in the tracking metrics in GA4 which report on user activity on a website.
User behaviour describes how people interact when they visit a website and can refer to a number of things, like how much time they spend on a page and how many pages they visit.
Unlike the established UA version, the new GA4 uses event-based tracking which, rather than simply showing how many sessions a certain page has, will provide more detail on the users and interactions with each page. This new approach requires some new behaviour metrics that reveal more about the user than just the session itself.
One element of user behaviour is user engagement. GA4 now records average engagement time which is the amount of time someone spends on a web page ‘in focus’ (i.e. in the tab the user is currently viewing in a web browser) or on an app screen in the foreground (i.e. ‘in focus’), which enables the measurement of when users actively view or use the site or app.
UA defines ‘Avg. Time on Page’ as the average amount of time users spent viewing a specified page or screen, or set of pages or screens from when they started viewing page 1 and when they clicked to view page 2. This is whether or not the page is in focus, which can inflate that metric.
GA4 collects several events automatically, including the user_engagement event, which is automatically fired when the app or webpage is in the foreground and stopped when a user closes their tab or window, or when they navigate to another page or screen.
GA4 also defines ‘Average Engagement Time per Session’ as ‘User engagement duration per session’. This distinction is important to note in the transition to GA4 as, for example, when GA4 reports a page had a 48 seconds ‘Average Engagement Time per Session’, UA could report that page had a whopping 3 minutes ‘Avg. Time on Page, whether or not the user was actively viewing it for that time.
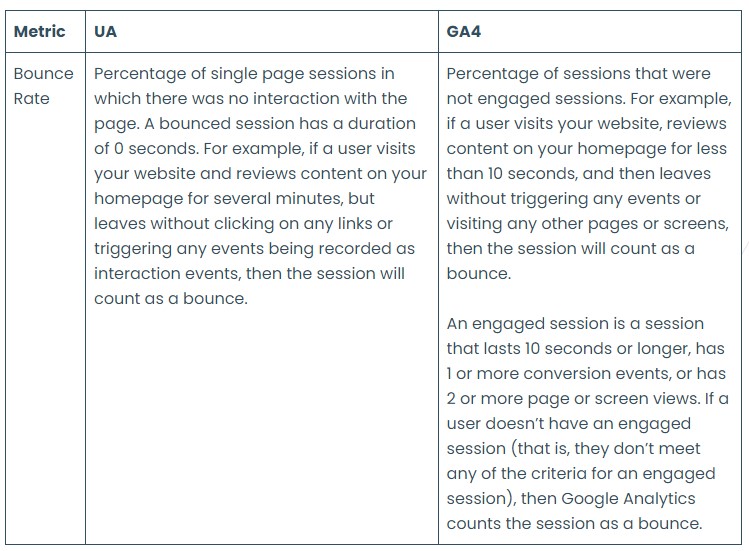
Another user engagement metric is ‘Bounce Rate’. As noted in our GA4 blog on Oct 28 2022, GA4 is retaining the UA’s bounce rate metric. However, that metric has changed, and is now the inverse of the Engaged Session metric. An engaged session is a session that lasts 10 seconds or longer, has 1 or more conversion events, or has 2 or more page or screen views.
Google’s documentation explains it well:
You can read more about comparing metrics in GA4 and UA in this useful article.
‘Engagement Rate’ is the percentage of sessions that meet the qualifications of engaged sessions, mentioned above. This new metric is preferable to use over Bounce Rate as it favours positive engagement, whereas Bounce Rate is one of the few negative metrics found within any version of Google Analytics.
Engagement Rate also more accurately reflects users who are interested in the website’s content and offerings.
It can be found in a few default reports in the GA4 interface:
- In the Demographic Details report, found under Reports -> Demographics -> Demographic details.
- If GA4 is linked to Google Search Console, it can also be found under the Google Organic Search Traffic report.
Engagement metrics can also be added to the standard reports by editing the viewable columns, or enabled in GA4’s ‘Explore’ tab to use in self-created custom reports. These can be added when selecting metrics for the report: Engaged sessions, Engaged sessions per user, and Engagement Rate to any created report.
Site owners should always aim for the highest engagement rate for their content, especially on the most important web pages. Look for opportunities on pages with lower than expected rates. It’s also worth comparing pages with low engagement rates to ones with high engagement to see if what is causing lower rates can be identified.
If you want to know more about how analysing user engagement can be used to improve your business’s website, please get in touch.