This month we continue our series of articles about the new Google Analytics 4 (GA4) reporting tool, with a look at the standard reports that are available from the new interface, and how these differ from the existing Universal Analytics report menu. We also report on the new demo account option, which can be a benefit to many users wanting to see GA4 in action.
The first thing you’ll notice when logging in to a new GA4 account / property is the change in the left hand report menu, which is significantly different to the established one that many regular users of Google Analytics (Universal) will be familiar with. There is still the Home link at the top of a GA4 property, where you start with a dashboard view, and also a Real Time set of reports, but the Customization section has disappeared.
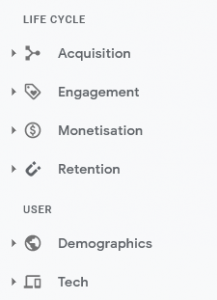 The new GA4 menu is now also divided into different sections, with some similar terminology as well as new headings. The first section of the menu is called ‘Life Cycle’ and reports on the key summary stats for your online business (or app), with a short grouping of reports under the following headings:
Acquisition: the traffic sources, mediums, and campaigns through which you acquire users
Engagement: user engagement by events and pages, or screens for app marketers
Monetization: if your site is ecommerce, this set of reports shows buyer volume, and revenue by items, promotions, and coupons
Retention: retention by new and returning users, cohorts, and lifetime value.
The next section is called ‘User’ and has a few reports on:
Demographics: user volume by demographic dimension
Technology: user adoption of app releases and the technologies used to engage your content
When you click into a section you can expand the reports to view the main overview reports for the category and then some more detailed ‘explorer’ reports. There are also summary cards in each overview report generally include one metric and one dimension, and address a single question about your business, such as, “What are your user demographics?” You can drill into a more comprehensive explorer report by clicking the link at the bottom.
The remaining sections in the menu are ‘Events’ which lists the events being tracked (as we covered previously) and also those events that are included as Conversions. There is the Explore section where reports can be created (and we’ll cover this in more detail in a future post), as well as Configure which is where Audiences and Custom Definitions can be added, as well as a DubugView section.
One good development in the last month has been the inclusion of GA4 properties in the Google Analytics Demo Account. This feature has been around for some years and allowed Analytics users to link an active Google account / property (for their Merchandise Store) into their own account to view reports for an active ecommerce store, as Read Only.
This Demo Account – which can be accessed and added from here – now includes the active GA4 property for this website, plus an additional one for a mobile app called Flood It!. So if you haven’t yet set up or viewed the new set of reports for GA4, this is a good place to start and you can then review all the reports with real data, and particularly if you run an ecommerce website. There are also some reports set up in the Explore / Analysis section so you can see what sort of reports can be generated.
Once you link the Demo Account to your own Google Analytics login, it will be accessible from your account / property menu, and you can always remove yourself as a user at a future date if you no longer want to access this.
For more information or help with Google Analytics 4, or the Demo Account, please get in touch.