
Google Analytics 4 has formally rolled out an integrated, native Dashboards capability, transforming how businesses track and visualise critical data. Designed to streamline the tracking of essential business key performance indicators (KPIs), this feature eliminates the need to continuously switch between disparate, rigid reports. Instead, users can now experience a highly cohesive and structured single-page workspace directly within the core platform interface.
Core Features and Layout Capabilities
The primary allure of the updated feature resides in its flexible, grid-based canvas layout. This system grants users complete manual control over card placement, alignment, and sizing. By leveraging intuitive drag-and-drop functionality, creators can easily build tailored data charts. This is achieved by pulling specific dimensions and metrics from the right-hand panel directly onto the active workspace.
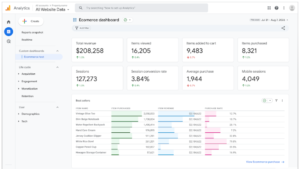
Six distinct visualisation types are natively supported:
- Score cards: Perfect for high-level KPIs and tracking percentage fluctuations across timeline periods
- Table charts: Excellent for deep data sets, featuring custom pagination and shaded bar displays
- Line charts & Bar charts: Built to map performance fluctuations over designated time granularities or compare individual dimensions
- Donut charts & Funnel charts: Ideal for monitoring how individual parts contribute to a whole or tracking exact customer conversion drops.
Permissions, Publishing and Existing Structural Limits
Constructing these assets requires specific organisational access. Only individuals assigned an Editor or Administrator role can build, modify, or successfully update a layout. Upon final creation, users can choose to publish their completed work directly to the left navigation bar, saving valuable time by entirely bypassing the secondary report library. Once published, these spaces are instantly shared and viewable by any user with standard property-level access.
However, the current rollout includes explicit platform boundaries. Standard properties face a strict constraint of 15 cards per dashboard, while premium 360 accounts scale up to a maximum limit of 30 cards. Furthermore, this initial iteration lacks external API compatibility, segmentation rules, or granular card-level comparisons. This means operations remain firmly contained within the unified platform environment.
You can read more about the new GA4 dashboards here, and if you want to know more about how the use of the these dashboards could help your business improve the tracking and visualisation of critical data, please get in touch.