We can all feel like Google Ads needs an explanation at times, and now Google has added a new ‘Explanations’ feature for users. This is currently in beta and may not be available yet in all accounts, but this new report can provide insights into the possible reasons for changes in trends over time.
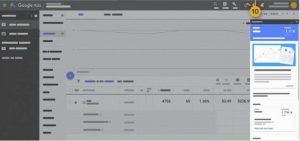 This new Explanations panel can only be accessed when you select a date range compared to another period in the Campaigns or AdGroups view, and then some of the trend metrics will be shown as a clickable hyperlink. By clicking on one of more of these links, a side Explanations panel will open to show possible reasons why there has been a change in the main metrics.
This data panel is similar to the Insights tool available in Google Analytics, in that Google’s system is looking at the changes to the key metrics in the account and providing suggestions for the cause, based either on changes made or notable fluctuations in the key metrics. Advertisers can therefore see where changes have occurred and review the possible explanations to find out why things changed.
Google says that the new Explanations panel in Google Ads can help advertisers learn more about how the following factors might have affected their campaign or ad group performance:
- Bid changes: How changes to bids may have affected where and how often the ads showed.
- Bid Modifier changes: How changes to device bid modifier, location bid modifier, demographic bid modifier and audience bid modifier may have affected performance.
- Budget changes: How changes to budget may have affected how many clicks and impressions the ads received.
- Budget allocation: How spreading the budget across multiple entities (for example, adgroups) may have affected the performance of other entities.
- Budget exhaustion rate: How changing the average cost per click (CPC) may have caused the budget to run out more quickly or slowly than usual.
- Eligibility: How different factors may have affected how often the ads were eligible for traffic (for example, budget exhaustion or pausing an ad group or campaign, when all ads in an ad group were disapproved).
- Change history: How changes to the account may have affected its performance.
- Targeting changes: How changes to location targeting, keywords targeting, keyword status and adding/removing an audience may affect performance.
- Auction competitions and search interest: How changes in search volume on Search partners and opt-in/opt-out of Search partners may affect performance.
This could become a valuable tool for advertisers to track the impact of changes that have been made and trend data is always an important set of metrics to review. The Explanations are designed to save time and put the information together all in one place, so that advertisers no longer have to cross-reference reports, checklists or other tools – by simply comparing two date ranges, and explanations for significant performance changes will be provided, if available.
If you’d like to know more about the new Explanations tool and how to use it to understand your campaign performance trends, please get in touch.