There have been several updates released recently to the Google Ads Report Editor which will feel more similar to Data Studio, making it easier to build reports and analyse data with the custom report builder.
The data selection panel has been improved in the following ways:
- The panel is now on the right-hand side of the Report Editor, giving more space to work in the report.
- Quickly find data fields for the report with a search function and add or remove them with a drag-and-drop experience.
- Chart icons have been added to help visualise, pick and configure the right chart for the report.
Also, new features have been added to help to format, filter and sort the report data. With conditional formatting, rules can be created to help data visualisation – like changing a cell’s background colour when it contains a specific value. In addition, data can now be filtered and sorted with new drop-down menus for each field.
Finally, to save time, it’s now possible to add new data fields into the report while it’s still loading.
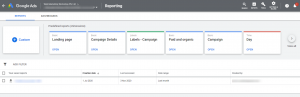
Custom reports in Report Editor are a indispensable way to visualise campaign performance in various ways without having to leave the user interface (UI). They also have optional segmentations like Location Type that aren’t in the main UI anymore.
Other useful existing features include the ability to report actions on ad extensions and if Ads conversion tracking is being used, different types can be specified such as tracking conversions for sales, newsletter sign-ups, and lead form submissions which allows the number of times each action was completed to be tallied easily.
You can read more here about creating custom reports in the Editor.
If you want to know how using the updated Report Editor and Custom reports can help your business’s online performance please get in touch.